Dashboard
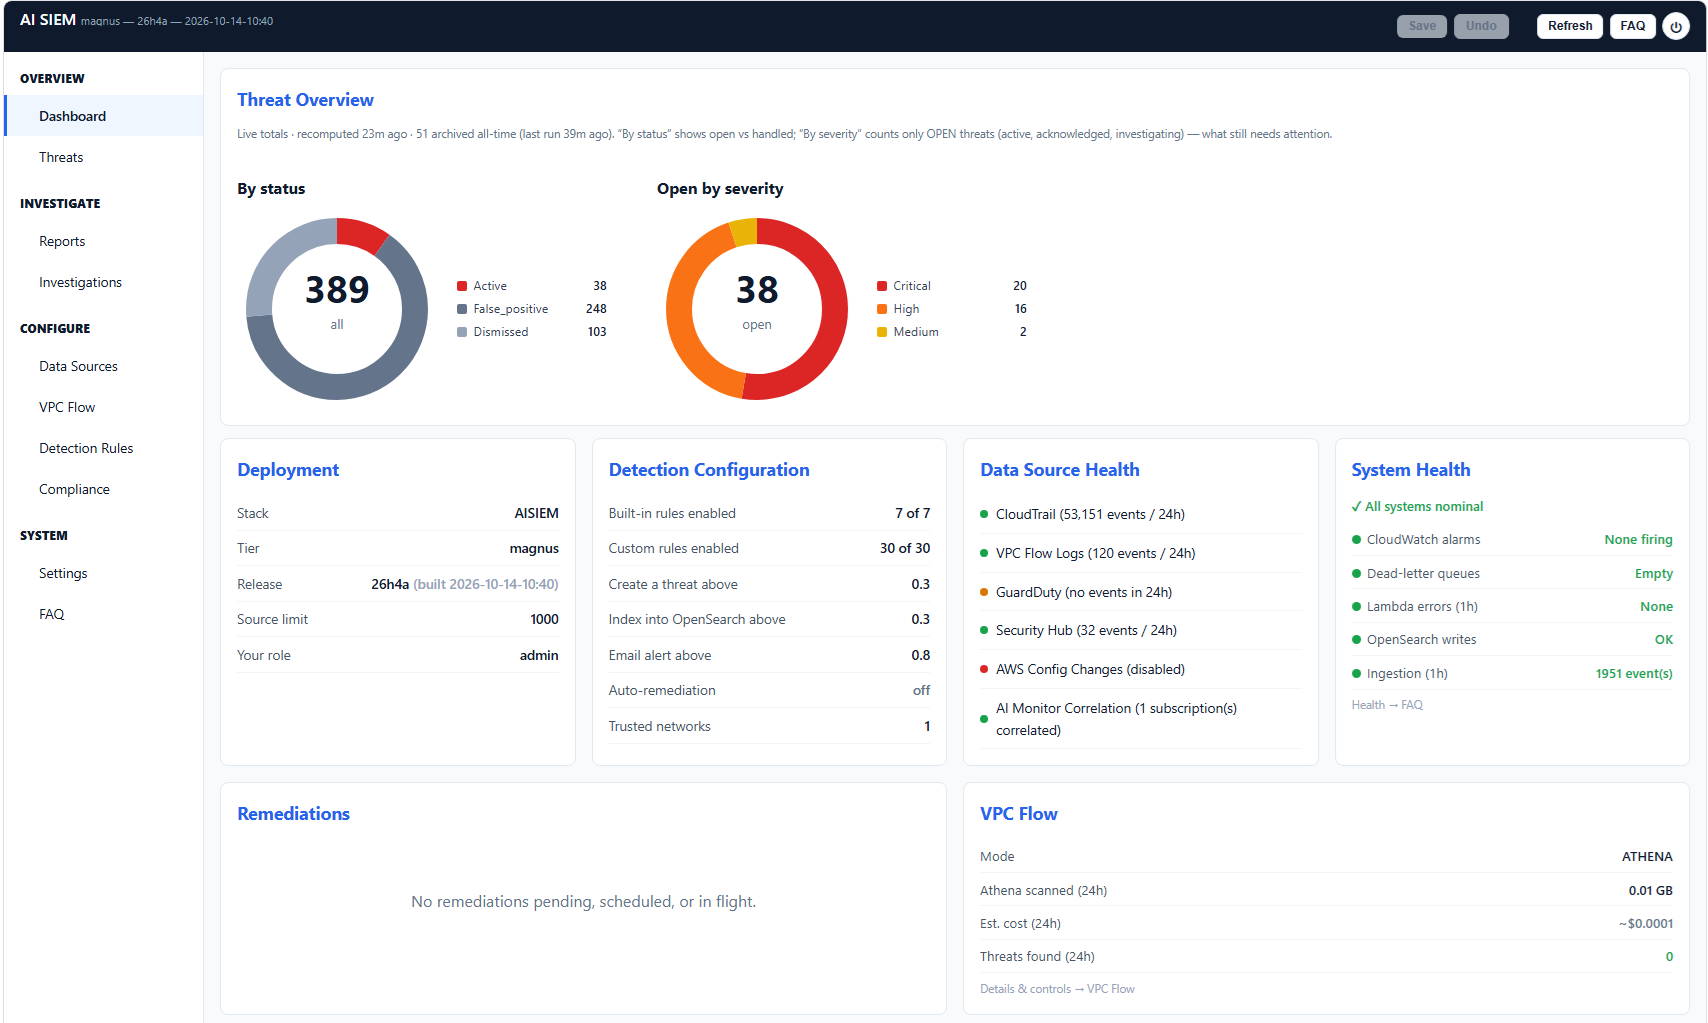
The editor dashboard is the live, at-a-glance view of your deployment — what is being detected, how the pipeline is doing, and which sources are healthy. It is the authoritative live count for threats; the OpenSearch AI SIEM — Threat Overview dashboard mirrors the same data for time-filtered analysis.
Left navigation
The sidebar groups every panel into four sections. Items gated by tier or feature only appear when your deployment includes them.
Overview
- Dashboard — this view: live threat totals, data-source health, and pipeline status.
- Threats — the triage queue. Filter by status, severity, type, time window, and assignee; open a threat for its Summary and Details tabs.
Investigate
- Reports — generate and view scheduled or on-demand threat reports (advanced+).
- Investigations — point-and-click threat search over any date range against the long-retention forensic archive (advanced+). See threat reports.
Configure
- Data Sources — register CloudTrail / VPC Flow Log buckets and see the AI Monitor Correlation panel.
- VPC Flow — choose the flow analysis mode, tune thresholds (including per-VPC), and watch flow health (essential/flow tiers). See per-VPC tuning.
- Detection Rules — built-in rule exclusions and custom rules. See custom detection rules.
- Compliance — monitoring coverage for CIS, HIPAA, NIST 800-53, PCI DSS and SOC 2 controls, with each control's open threats to review. See compliance posture.
System
- Settings — threat retention and archive, display timezone, and other deployment settings.
- FAQ — live deployment diagnostics and FAQs
Header controls
The top bar carries the global actions and status, to the right of the title:
- Save — review and apply all configuration changes across every panel at once. Disabled until there is something to save; edits accumulate into one working copy. See configuration integrity.
- Undo — discard all unsaved changes and reload the saved configuration from the server. Disabled when there is nothing to discard.
- Refresh — reload threats and data-source health from the server. Use after acting on threats or changing sources.
- FAQ — open the deployment diagnostics: live checks of entitlement, OpenSearch, indices, alert delivery, config, and Bedrock access for this stack.
- Sign out — ends your session and returns you to the logged-out page.
Two status chips appear here when relevant: an Unsaved changes indicator whenever the working copy differs from what is saved, and a presence indicator showing when other administrators are in the editor (advisory only — nobody is blocked). See response and remediation for the multi-admin safeguards these back.
Threat Overview
The Threat Overview donuts show true whole-table counts by status and severity, kept live as threats are created and triaged — not a sample of the loaded page. A "live totals" note shows when the counts were last reconciled and how many threats have been archived all-time, so the numbers stay exact even after months of activity and automatic archiving. An active-by-severity breakdown shows where the open work is concentrated.
Response Times
A Response Times box shows, per severity band over the last 30 days, the median time from detection to acknowledge (the first status change away from Active) and to resolve (Resolved, False positive or Dismissed), with how many threats were measured. Assigning a threat does not count as acknowledging it, and reopening a threat does not reset its original times.
Targets are optional and yours to set, per band, under Settings → Response Targets; AI SIEM suggests no values. When a band has a target, the box adds the share of threats within it and counts of open threats overdue to acknowledge or resolve. When anything is overdue, a Past response target banner appears above the Threat Overview, and both link to the Overdue view in Threats, oldest first. An optional daily email summarizes what is overdue.
Every measured time is also written to the status record in the tamper-evident audit trail, and the targets in force are part of each configuration snapshot.
Retention
A Retention box shows open threats about to be archived (only when Keep open threats past the age cap is off), how close the live list is to its high-water mark, and any open threats the last archive run removed. Each line links to the threats or setting behind it.
Data Source Health
A card shows each configured source and whether it is actually delivering — CloudTrail, VPC Flow Logs, GuardDuty, Security Hub, and AWS Config, plus an AI Monitor Correlation row (advanced+). The correlation row reflects how correlation is wired: not configured (AI Monitor stack not set), no subscriptions correlated yet, or healthy with a count of the subscriptions you have opted in — so a glance tells you whether anomaly correlation is actually active.
Status values match the health indicators in getting started: Ingesting, Enabled but no S3 bucket configured, AWS service not enabled, No events in 24h, and Disabled. Read failures report unknown rather than a false green, so the dashboard errs toward surfacing a problem.
Remediations
For enterprise deployments, a Remediations panel tracks response activity, including a running SLA breached count that jumps straight to the list of remediations that ran long or were never picked up in time. Remediation state (pending, scheduled, remediating, remediated, failed, stalled) is tracked per action, independent of triage status. See response and remediation.
VPC Flow health
When flow-log detection is enabled, a VPC Flow panel surfaces live flow health — an estimated scan-cost indicator, flow-query Lambda activity, sweep runs and threats found, and an on-demand "top talkers" query. See the flow-log cost guardrail and per-VPC tuning.
Operational oversight (CloudWatch)
Separate from the editor dashboard, AI SIEM ships a CloudWatch operations dashboard that leads with an alarm-status panel summarizing every AI SIEM alarm at a glance — a monitor-the-monitor layer that catches a problem even when the editor is not open. It covers the security signal (a critical-threat alarm) and pipeline health (dead-letter queues, detection-queue backlog, Lambda errors, the remediation scheduler heartbeat, sustained OpenSearch write failures, WORM audit write failures, and the daily archive pass). See the operational-oversight notes in getting started.
Threats populate OpenSearch dashboards
Each detected threat is mirrored into the AI SIEM — Threat Overview OpenSearch dashboard, which shows total and active threat counts and an active-by-severity breakdown. Status changes propagate so the active views track triage, and a daily reconcile self-heals the projection after any transient outage. The editor dashboard remains the authoritative live count; the OpenSearch view is time-filtered.