Frequently Asked Questions
Does AI Monitor require Log Processor?
Yes. AI Monitor deploys as a guest on a running Log Processor stack — it uses the same VPC, subnets, and OpenSearch domain. Log Processor owns the cluster; AI Monitor writes to its own OpenSearch index pattern (metrics-*) and reads other metric baselines for correlation. Example metric dashboards are provisioned, and you can create your own (see the dashboards list).
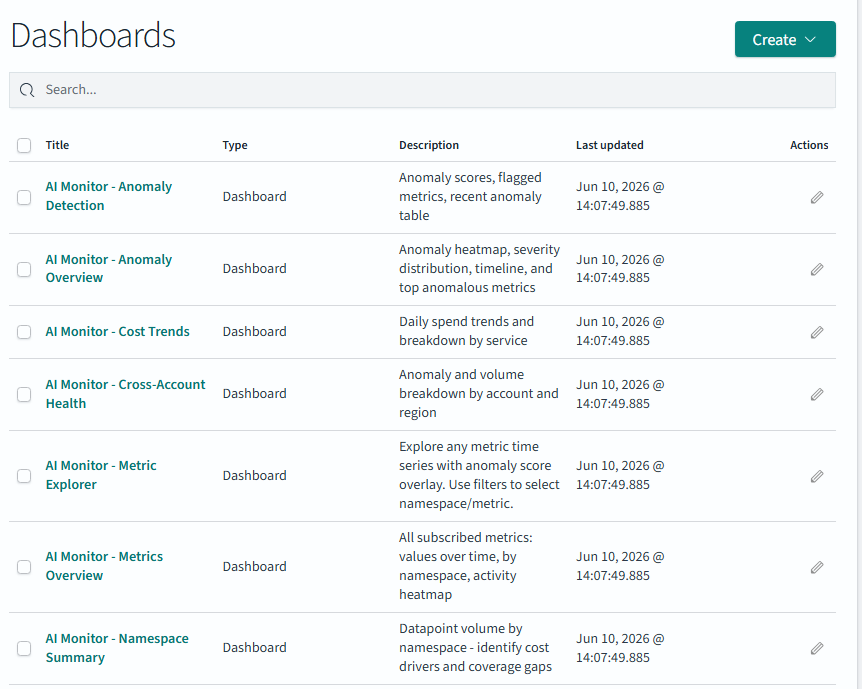
Can I use my company's SSO (Okta, Azure AD, etc.)?
Yes, on the enterprise plan. Add your SAML or OIDC identity provider to the Cognito User Pool using the sso helper script. Users then see a "Sign in with [Provider]" button on the login page. After first login, assign groups with the groups script for role-based access. See the helper scripts README for details.
How does anomaly detection work without thresholds?
Each metric subscription gets its own Random Cut Forest model that maintains a sliding window of recent values. After the baseline period, the detector computes a z-score-based anomaly score (0–10) for each new datapoint. Scores above the configurable threshold (default 3.0) trigger alerts. The model continuously adapts — daily patterns, gradual drift, and weekly cycles are learned automatically via per-day-of-week baselines.
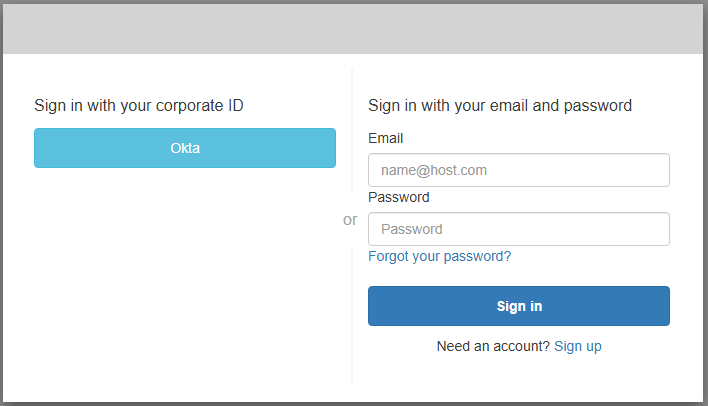
What's the difference between anomaly detection and "Alert if below/above"?
Anomaly detection learns what's normal for your metric and alerts when behavior deviates unexpectedly — sudden spikes, unusual drops, weekend vs weekday differences. "Alert if below/above" is a static safety net — a hard floor or ceiling that fires immediately regardless of learned behavior. Use it for absolute limits where any breach is critical (for example, free disk below 10 GB, CPU above 95%). You can use both together on the same subscription: anomaly detection handles the subtle and unknown, static thresholds handle the "must never cross this line" cases.
What is the correlation engine?
When an anomaly is detected (compact tier and above), the correlation engine checks which other metrics also showed unusual behavior in the same time window (z-score > 2.0). The alert may include these correlated signals — helping you determine whether an anomaly is isolated or part of a broader incident.
How do maintenance windows work?
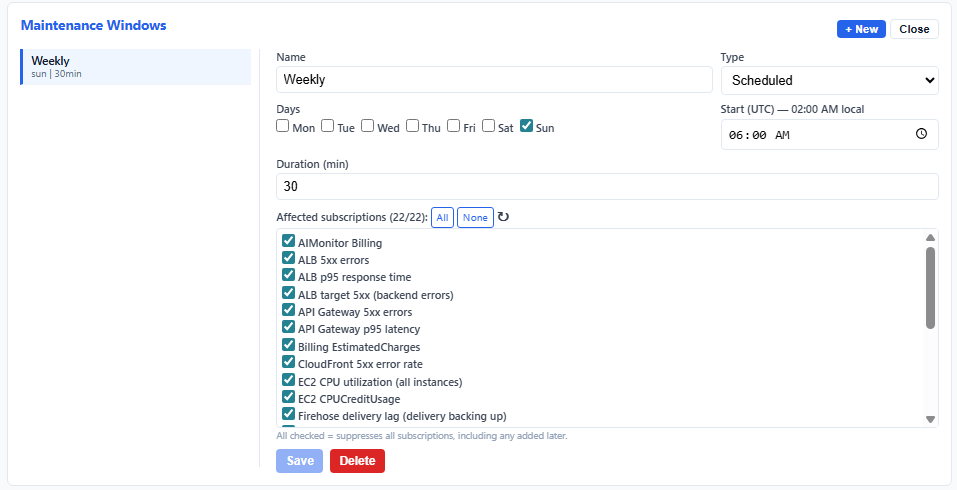
Create recurring schedules (for example, "Wednesdays 02:00–04:00 UTC") or one-time windows in the editor. Anomalies detected during these periods are recorded but suppressed — no alerts fire. Apply windows globally or to specific subscriptions.
Does my data leave my AWS account?
No. Everything runs inside your VPC. Metric Streams → Firehose → S3 → Lambda → OpenSearch — all within your account. The only external call is a periodic Marketplace entitlement check.
How does cross-account work?
On advanced and enterprise tiers, provide the organization ID and/or remote account IDs during deployment. The stack allows remote accounts to forward metrics into the central account. Remote accounts deploy their own CloudWatch Metric Stream. Data lands in S3 partitioned by source account ID — all metrics queryable from a single OpenSearch instance.
What happens when I add or remove subscriptions?
The editor immediately updates the CloudWatch Metric Stream's include filters to only stream namespaces with active subscriptions. Adding the first subscription in a namespace starts streaming; removing the last one stops it. Zero subscriptions means the stream is paused entirely — no Firehose or S3 costs when idle.
Can I run multiple AI Monitor instances?
Yes. Each AI Monitor stack is fully independent — deploy multiple stacks with different names, each paired to a specific Log Processor instance. For example, deploy AIMonProd targeting LogProcProd and AIMonDev targeting LogProcDev. Each gets its own metric stream, Firehose, S3 buckets, DynamoDB, editor, ALB, and Cognito. No resource collisions and no shared state — useful for separate environments (dev/staging/prod), different teams, or different AWS accounts with their own Log Processor deployments.
Can I send alerts to Slack, Teams, or PagerDuty instead of email?
Yes. The alert topic is a standard SNS topic — add your own subscriptions for any protocol SNS supports: HTTPS (webhooks), Lambda, SQS, SMS, and more. For Slack or Teams, use AWS Chatbot or subscribe an HTTPS endpoint with your webhook URL. For PagerDuty or OpsGenie, subscribe their SNS integration endpoint. Email and webhook subscribers can be active simultaneously.
Every alert includes SNS message attributes: severity (high/medium/low), score (0–10), namespace, metricName, subscriptionId, description, and accountId. Use SNS subscription filter policies to route by any combination — for example, only page on-call for {"severity": ["high"]} (score ≥ 7), route a specific subscription to a dedicated Slack channel, or escalate only production account anomalies.
Can I automate responses to anomalies?
Yes. Subscribe a Lambda function, SQS queue, or HTTPS webhook to the SNS alert topic. Use SNS filter policies on message attributes (severity, score, namespace, metricName) to trigger specific automations — for example, auto-scale an ECS service only when {"severity": ["high"], "namespace": ["AWS/ECS"]}, create a Jira ticket for all anomalies, or invoke a Step Functions workflow for multi-step remediation. Any tool that accepts SNS or webhooks works: Zapier, n8n, EventBridge, custom APIs.
Can I change tiers later?
Yes. Update the CloudFormation stack with a new tier parameter. Subscription limits, detection intervals, and feature gates update immediately. Baselines and anomaly history are preserved in DynamoDB.
Do the AI features send my data to a third party?
No. AI Monitor's AI features — anomaly explanations, tuning suggestions, and report summaries (advanced tier and above) — run on Amazon Bedrock inside your own AWS account and Region, called by the stack's own Lambda role. Nothing is sent to us or to the model provider, and per AWS's Bedrock terms your prompts are never used to train the models. Resource identifiers are kept out of the prompts — never the specific values, account IDs, or Regions. AI features are optional.
How does AI Monitor learn daily and weekly patterns?
The detector maintains separate baselines per day of week (Monday through Sunday). Each day builds its own sliding window of normal values over time. After about one week, the system knows that "Monday morning traffic" differs from "Sunday night quiet" and scores accordingly. Until per-day data is sufficient, it falls back to an overall baseline. This eliminates the most common source of false positives — weekly traffic cycles.
Will I get false positives while the baseline is still training?
Likely. The detector begins alerting after just 15 data points (~75 minutes), even though full training requires 288 points per day-of-week (~24 hours of data per weekday). During early training:
- Alerts are marked "⚠ Low confidence" in the email subject when training is below 50%.
- The alert body shows training percentage (for example, "Fri baseline: 35% trained").
- The anomaly detail in the editor displays training status.
This is by design — a genuine spike from 200 ms to 5000 ms should alert immediately even with a thin baseline. To suppress all alerts during initial learning, set the baselineDays field on the subscription (for example, 7). The detector will score but not alert until that period passes. After one full week, day-of-week baselines stabilize and false positives drop significantly.
Can I monitor all AWS services with one subscription?
Yes. Use regex wildcards in dimension values. For example, setting dimensions to {"DeliveryStreamName": ".*"} monitors every entity independently — each gets its own baseline. One subscription (current and future), unlimited resources.
Why does my baseline show "reports infrequently" instead of the daily grid?
Metrics that emit fewer than ~15 datapoints per day (for example, daily billing or Trusted Advisor checks) use an aggregate baseline across all days rather than per-day-of-week patterns. The detector still scores these metrics normally — it just doesn't have enough data to distinguish Monday behavior from Friday behavior.
Can I suppress email alerts but still record anomalies?
Yes. Each subscription has an "Email" toggle (on/off) and an "Email threshold" (0–10). Set Email to No for fully silent recording — anomalies are stored in DynamoDB and visible in the editor but no notifications are sent. Or set the Email threshold to 5.0 to only receive emails for significant anomalies while low-severity ones are recorded silently.
What do the trend indicators mean?
The subscription list shows arrows indicating anomaly frequency trends: red up (worsening — more anomalies this week than last), green down (improving — fewer this week), grey right (stable), blue star (new — no prior week data), and "off" (metric disabled). A persistently worsening trend suggests a systemic issue beyond individual alert triage.
What AWS infrastructure costs should I expect?
Typical costs for a compact-tier deployment with 20 active metrics: Metric Streams ~$3/mo, Firehose ~$1/mo, S3 ~$0.50/mo, Lambda (collector, detector, billing, discovery) ~$2/mo, DynamoDB ~$0.50/mo — roughly $7–12/mo of infrastructure on top of the software fee. OpenSearch is shared with Log Processor, so there's no additional cluster cost. On advanced and above tiers, the Bedrock VPC endpoint adds ~$7/mo and AI suggestions cost ~$0.001 per query. Cross-account adds a Metric Stream per remote account (~$3/mo each).
How does cost anomaly detection work?
A daily billing processor queries AWS/Billing EstimatedCharges data from OpenSearch, computes the day-over-day spend delta per service, and writes derived DailySpend metrics back. The detector then scores these like any other metric using day-of-week baselines, so it learns that "Tuesdays cost more than Sundays" and only alerts on genuine cost spikes — not normal weekly patterns. Subscribe to AIMonitor/Billing / DailySpend with {"ServiceName": ".*"} to monitor all services independently.
How does the discovery wizard work?
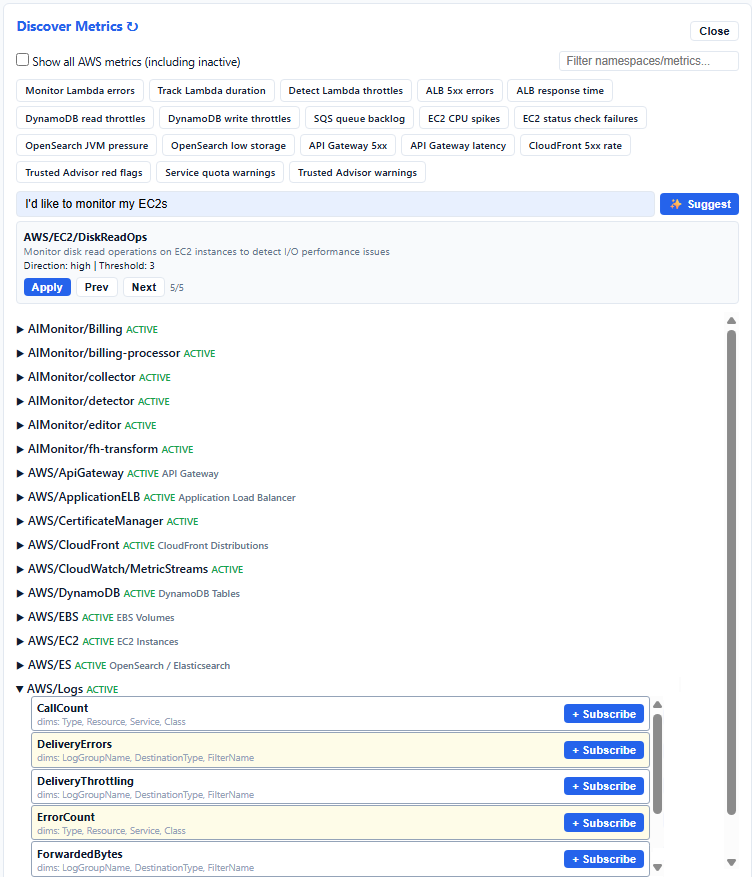
A scheduled Lambda calls CloudWatch ListMetrics every 6 hours and caches all available namespaces, metrics, and dimension values. The editor merges this with a comprehensive AWS metrics catalog (40+ services) to show you everything you could monitor. Active metrics are highlighted; inactive ones can be shown via a toggle. Click "+ Subscribe" to pre-fill the form with smart defaults including wildcard dimensions and suggested thresholds. Click the refresh icon to update the cache on demand (~30 seconds) after you've added new resources.
What's included in an anomaly report?
Each report is a self-contained HTML page covering a configurable lookback window (default 7 days). It includes total anomalies with severity breakdown (high/medium/low), anomaly trend direction per subscription, top anomalous metrics ranked by count, day-of-week distribution, top dimensions (resources), per-account breakdown, cost analysis (daily spend vs 7-day average with % change), maintenance window details (type, schedule, duration, suppressed count), baseline training status, and full system health checks across all Lambda functions.
Is my anomaly data backed up?
On advanced and enterprise tiers, DynamoDB point-in-time recovery (PITR) is automatically enabled, providing continuous backups with restore to any second within the last 35 days. Baselines, anomaly history, and maintenance state are all protected. On lower tiers, baselines rebuild automatically from incoming data within 1–2 weeks if lost.
How do I enable AI features (discovery suggestions, anomaly explanations, and tuning)?
AI features require Amazon Bedrock access to Anthropic Claude models. Use the provided check-quota script to verify access and sufficient resources, and submit requests as recommended. AI features are available on advanced and enterprise tiers only.
How does AI Monitor use AI?
AI Monitor uses Amazon Bedrock (Claude) to generate metric suggestions, tuning recommendations, and anomaly explanations. These are provided as guidance only and may be inaccurate, incomplete, or inappropriate for your specific environment. Always review and validate suggestions before applying them — you are responsible for your monitoring configuration and alert thresholds. Costs are negligible at ~$0.001–0.002 per call.
What are the AI-powered suggestions?
On advanced and enterprise tiers, the discovery wizard includes a natural language prompt. Type something like "monitor my Lambda errors" or "alert me if S3 costs spike" and Bedrock (Claude) returns a fully configured subscription suggestion based on your available metrics. For ambiguous requests, click Next to get additional suggestions, then navigate through them with Prev/Next and apply the ones you want. In all tiers you can also browse metrics manually or use the clickable chips, which pre-fill the form using built-in smart mappings — no AI call needed.
What is the AI anomaly explanation?
On advanced and enterprise tiers, each anomaly alert includes an AI-generated analysis section. Bedrock (Claude) receives the anomaly context — metric name, current value, baseline mean, score, and any correlated metrics — and produces a 2–3 sentence explanation: likely cause, what to investigate first, and whether it's probably a real issue or noise. It's labeled "AI Analysis (experimental)" in the email.
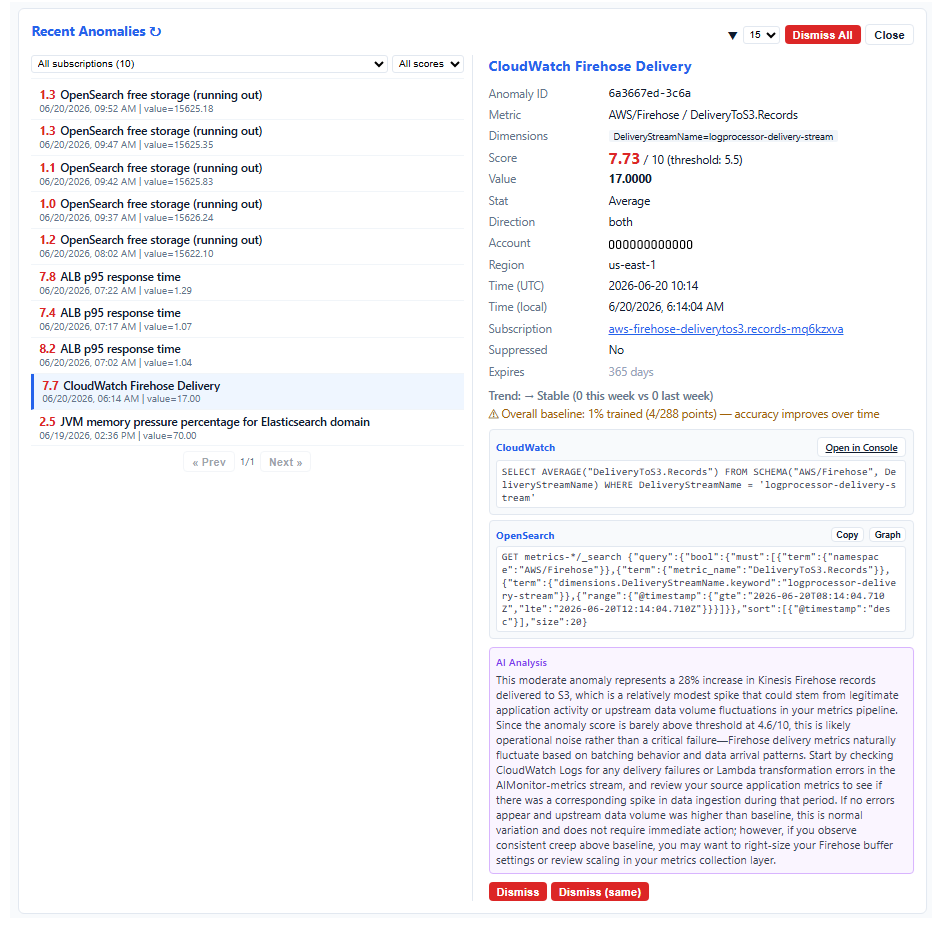
What is the AI-assisted tuning?
On advanced and enterprise tiers, in Recent Anomalies, click the subscription link to view its details, then click "Tune." Bedrock (Claude) leverages recurring anomaly history and suggests changes you can apply. Cost is ~$0.0003 per tune.
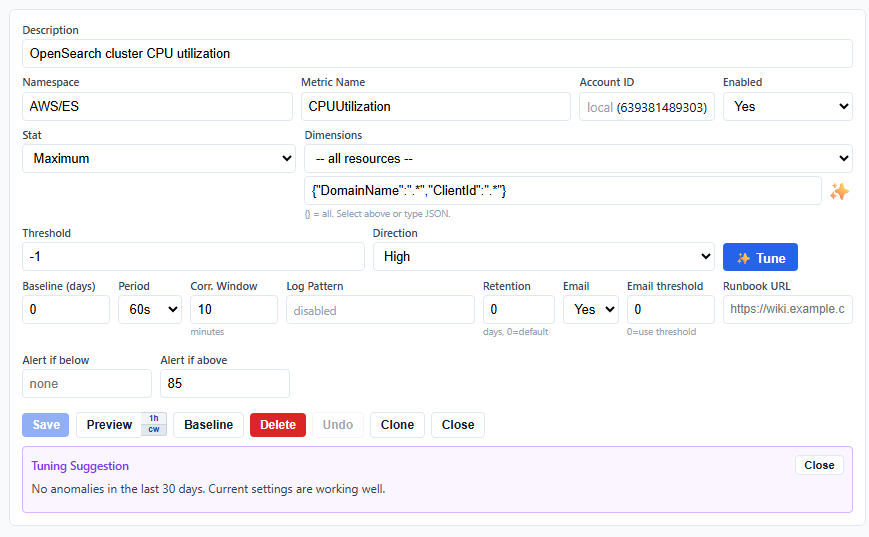
Why does Tune use rules instead of pure AI?
Language models are great at explaining things but unreliable at picking numbers. A model might suggest a 7-day queue ceiling because it saw a large max value and multiplied confidently. Our rules-based engine uses your actual anomaly frequency, metric type, and observed percentiles to compute thresholds — then Bedrock writes the explanation. You get consistent, repeatable recommendations grounded in your data, not creative math from a language model.
Does it monitor AWS Trusted Advisor?
Yes. AI Monitor detects anomalies in Trusted Advisor checks:
- RedFlagChecks — Critical findings: exposed S3 buckets, IAM keys without MFA, security groups with unrestricted access, root account usage, idle load balancers costing money. A spike means new vulnerabilities appeared.
- YellowFlagChecks — Warnings: underutilized EC2 instances, EBS volumes without snapshots, aging access keys, RDS instances without Multi-AZ. A rising count means infrastructure hygiene is slipping.
- ServiceLimitUsage — Quota consumption: VPCs, EIPs, Lambda concurrent executions, RDS instances, CloudFormation stacks approaching hard limits. An anomaly here means you're growing toward a service limit that will cause hard failures with no graceful degradation.
Traditional monitoring misses these because they're audit findings that change infrequently, not operational metrics. AI Monitor's baseline detects when "normal = 2 red flags" becomes "5 red flags overnight" and alerts you before the next security review finds them first.
What is the Log Pattern field?
When an anomaly fires, AI Monitor searches OpenSearch logs for entries matching a pattern within the correlation window. By default it looks for ERROR, Exception, and FATAL entries. If your Log Processor has custom pattern rules configured, you can select one or more patterns instead (for example, secrets, slow queries, connection errors). Results appear in the anomaly detail view under "Correlated Log Entries." This feature requires the advanced tier or above.
Does cost monitoring work with multiple accounts?
Yes. If cross-account metric streams include AWS/Billing from linked accounts, the billing processor computes per-account per-service deltas. Alerts include the account ID so you know exactly which account is spending more. Note: AWS/Billing metrics only exist in the payer (management) account unless billing access is delegated to member accounts.