AI Monitor
AI/ML-powered anomaly detection for AWS CloudWatch metrics. AI Monitor automatically learns normal behavior per metric and alerts on deviations — no static thresholds to maintain. When an anomaly fires, it correlates with other metrics (and optionally logs) to give you instant context, and an AI discovery wizard helps you find what to monitor.
It deploys via CloudFormation directly into your AWS account and runs entirely inside your VPC — no metric data leaves your account.
Who it's for
Teams running workloads on AWS who are tired of tuning static CloudWatch alarms, drowning in false positives from weekly traffic cycles, or paying unpredictable per-metric SaaS bills. AI Monitor replaces hand-set thresholds with per-metric baselines that adapt to daily and day-of-week patterns.
One-line value
Monitoring without the guesswork: learn what's normal, alert on what isn't, and get the context to act.
Requires Log Processor
AI Monitor builds on the Perfware platform and requires Log Processor. It deploys as a guest onto Log Processor's shared VPC and OpenSearch domain — no new cluster — which keeps infrastructure cost low. The two products also pair for coverage: AI Monitor tells you something is wrong at the metric layer; Log Processor surfaces why from your logs. Anomalies can correlate into AI SIEM for cross-product correlation.
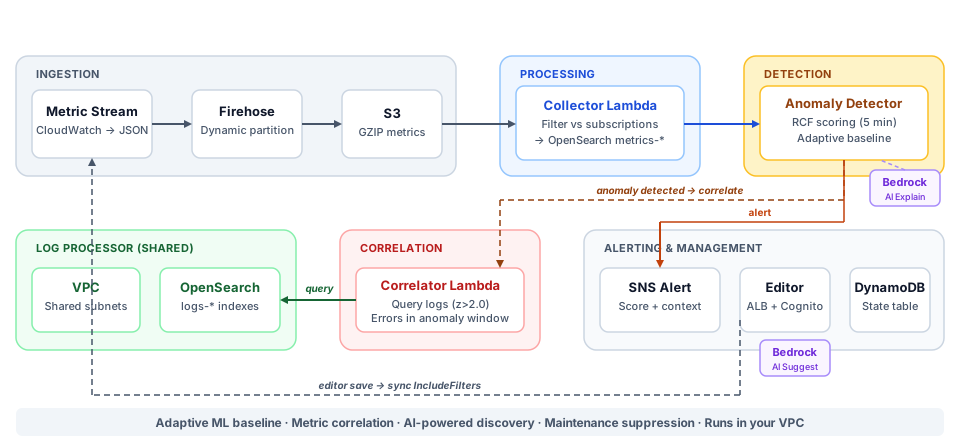
See the full architecture diagram for detail.
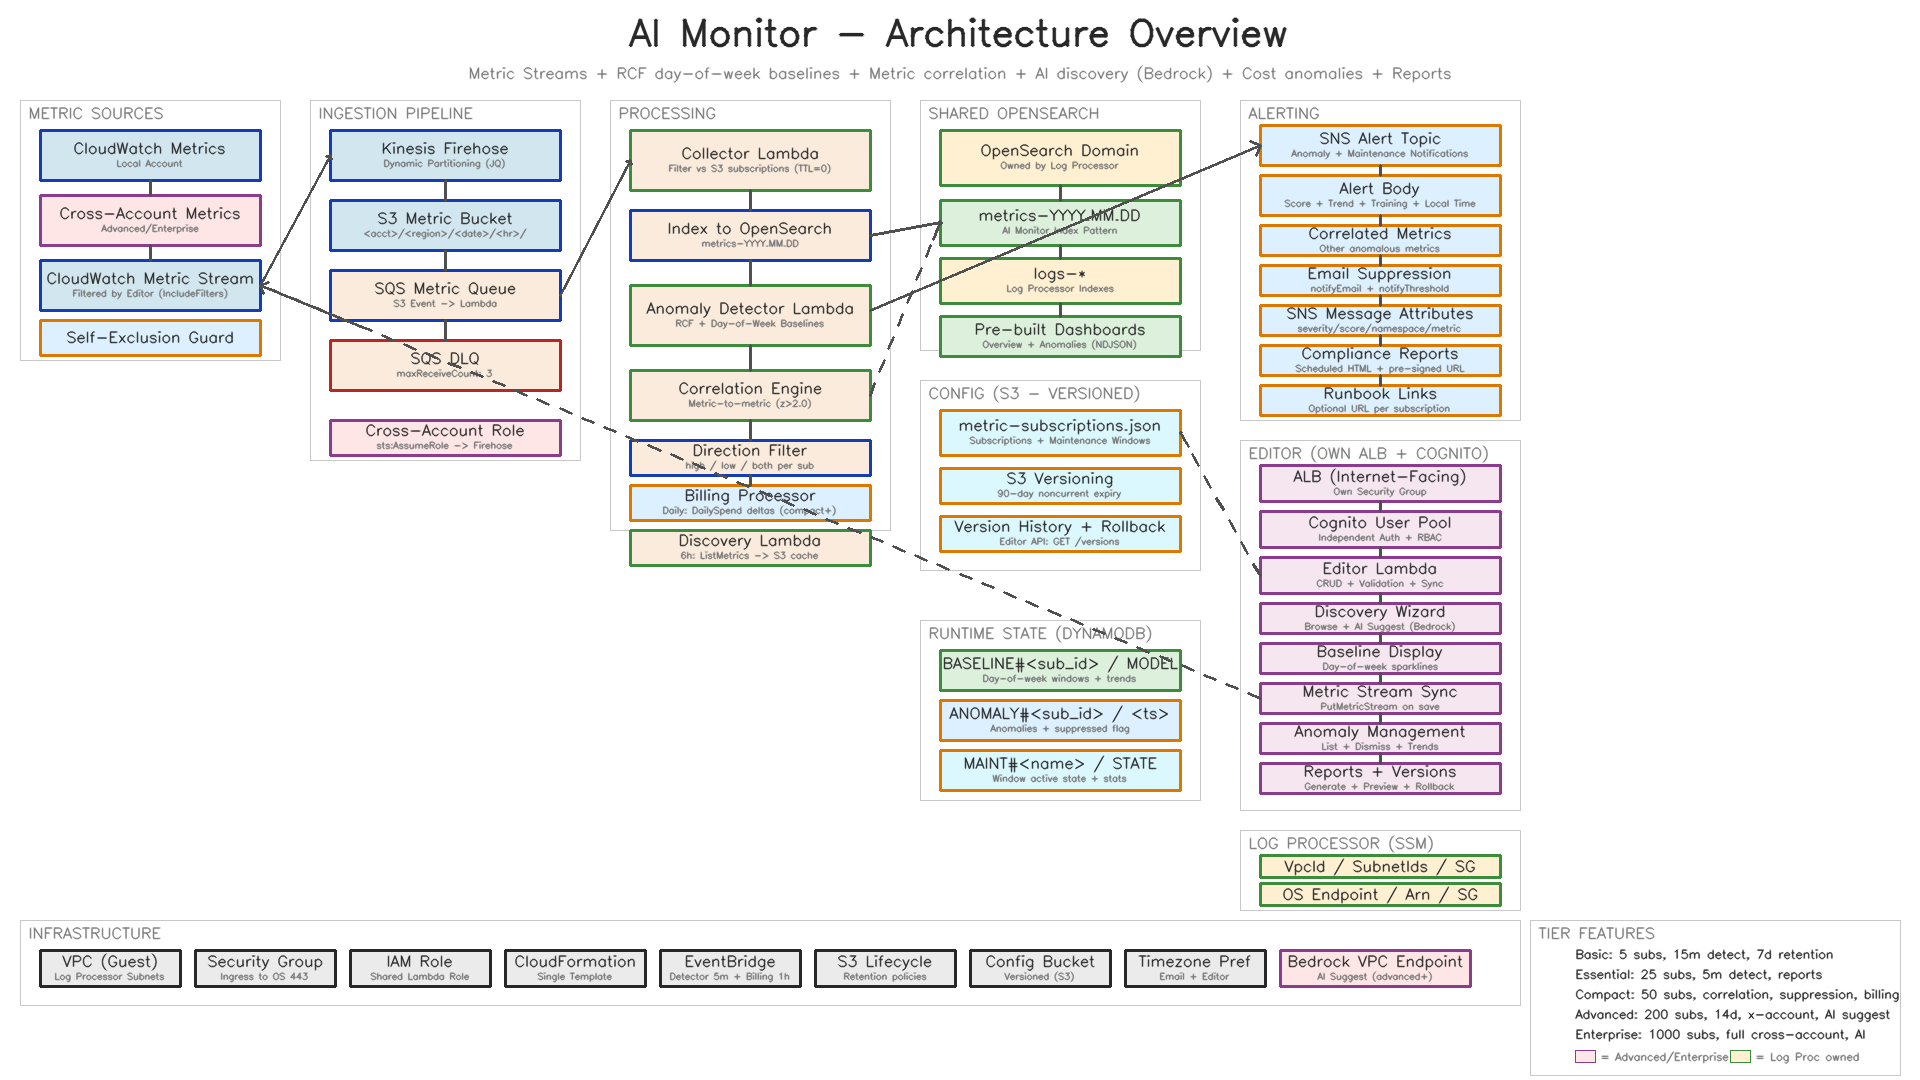
How it works
- Deploy — Subscribe in AWS Marketplace, launch the CloudFormation stack, and provide your Log Processor stack name and tier.
- Subscribe — Open the editor, browse CloudWatch namespaces, and select metrics. The Metric Stream starts flowing.
- Baseline — The detector builds a per-metric model over the training period (7–14 days depending on tier).
- Detect — Once the baseline is ready, deviations trigger alerts with an anomaly score and correlated metrics.
Start with Getting Started, browse the features, or review tiers and pricing.