Compliance Reports
On the Advanced tier and above, Log Processor generates automated compliance reports on a configurable schedule. Each report summarizes the past 7 days and is useful for organizations subject to SOC 2, HIPAA, PCI-DSS, or internal security audits — it provides documented evidence of what was processed, what was detected, and whether the pipeline was healthy.
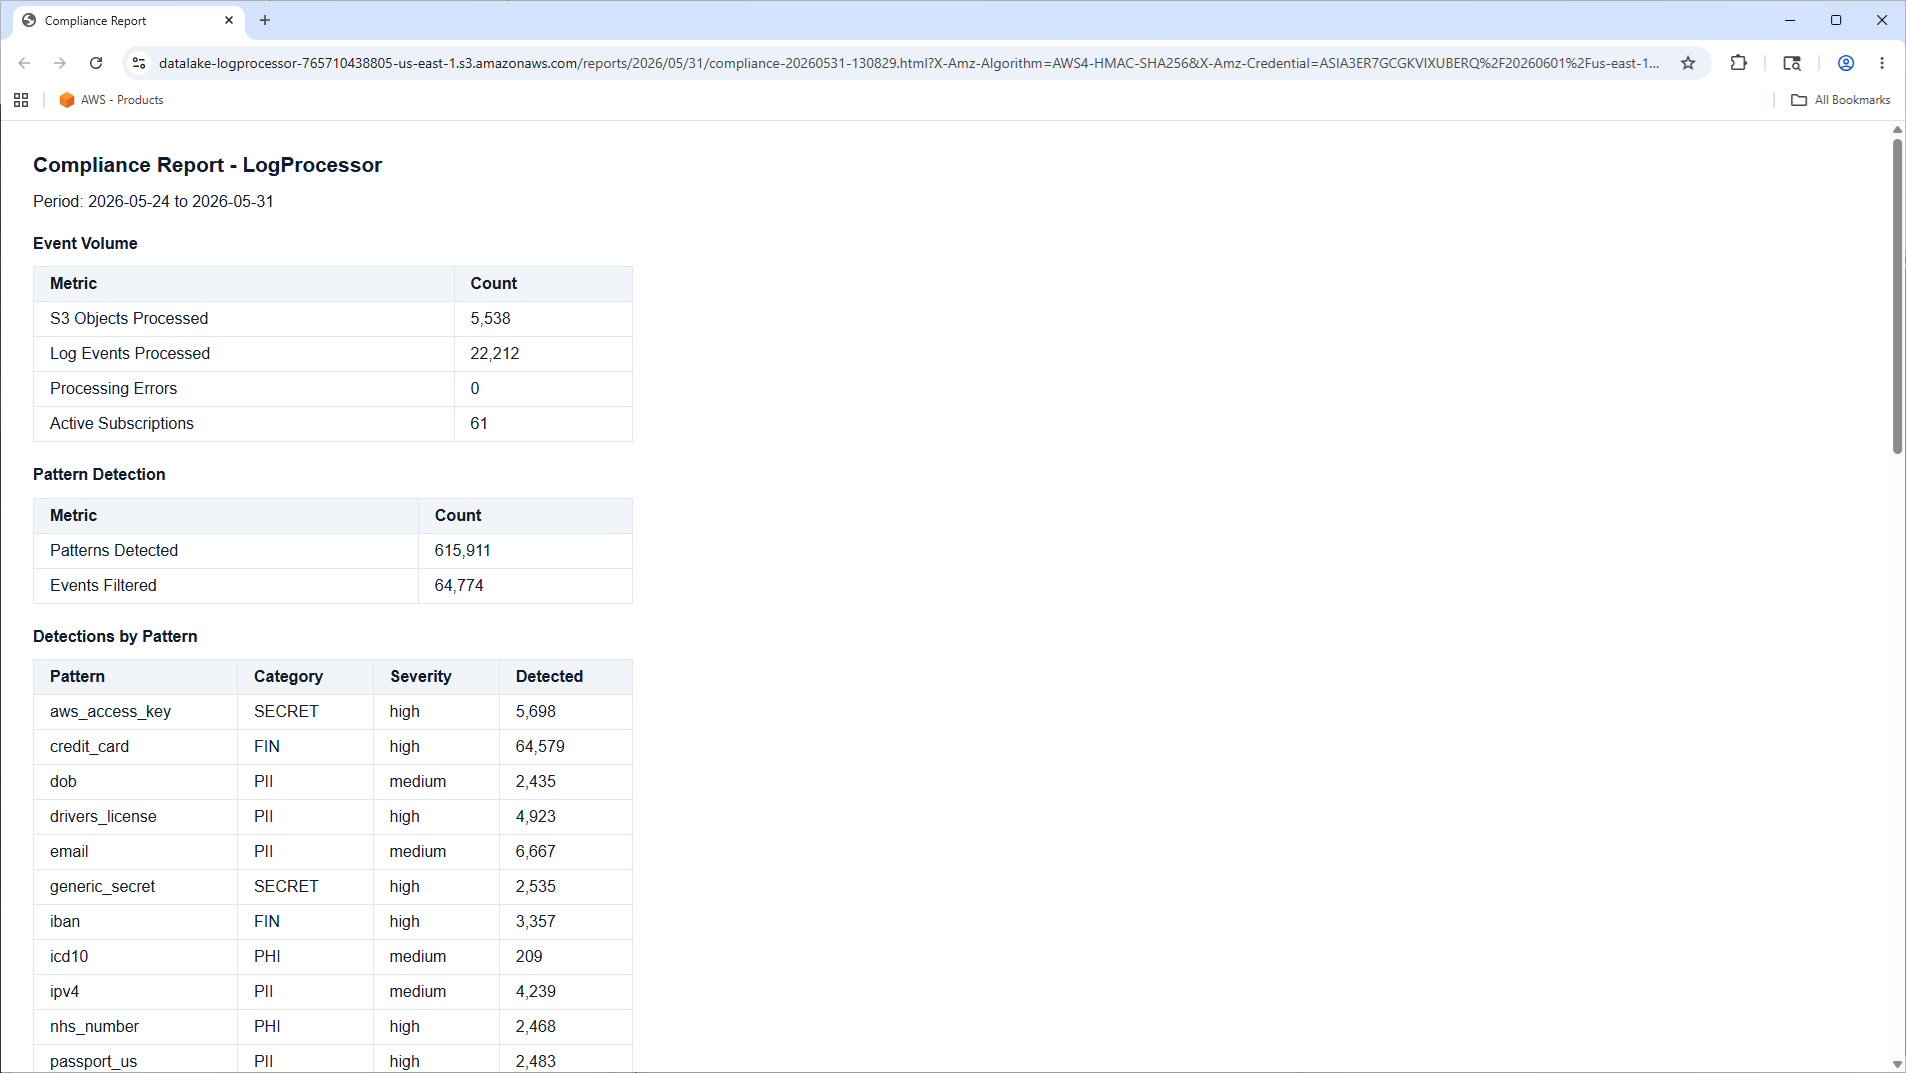
What a report includes
- Event volume — S3 objects processed, log events ingested, processing errors, and active subscription count.
- Pattern detection summary — total patterns detected and events filtered across all log groups.
- Detections by pattern type — per-pattern breakdown (e.g. SSN: 142 detected, email: 87 detected) from CloudWatch dimensioned metrics.
- Top log groups by volume — the 10 busiest log groups by event count (from OpenSearch).
- Pattern detections by log group — the 10 log groups with the most pattern hits (from OpenSearch).
- System health — diagnostics with traffic-light status indicators across the pipeline: DLQ depth, Lambda errors, OpenSearch status, and Firehose lag.
Delivery
Reports are saved to the datalake S3 bucket under reports/, and a pre-signed download link is emailed via the alarm SNS topic.
Scheduling and on-demand generation
Configure which days to auto-generate (for example Monday and Friday) and set the lookback window in the Subscription Editor, or generate a report on demand with the Report button. Compliance reports show the generation time in your local timezone.